InTDS ArchivebyLee VaughanDeclarative vs. Imperative PlottingAn overview for Python beginnersJan 10, 20242Jan 10, 20242
Fareed KhanMistake-Free Data VisualizationsData visualization is a powerful means of conveying complex information, but not all visualizations are created equal. In this…Nov 21, 20231Nov 21, 20231
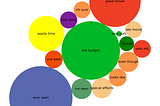
InTDS ArchivebyPetr KorabAdvanced Visualisations for Text Data AnalysisExplore n-gram word cloud, chord diagram, and a bubble chart, and their implementation in PythonMay 15, 20224May 15, 20224
InDev GeniusbyA. Uygur YiğitMake Your Charts More Eye-Catching and Informative in MatplotlibData visualization is a great technique for telling the story with data. On the other hand, building a chart alone is not enough to impress…Feb 4, 2023Feb 4, 2023
InData Engineer ThingsbyPatrick Nguyen9 Techniques to Discover Data NarrativesData Visualizations that improve overall dataset comprehensionJun 17, 20235Jun 17, 20235
InTDS ArchivebyAndreas LukitaPlotly and Pandas: Combining Forces for Effective Data VisualizationA quick guide inspired by Storytelling with DataJul 10, 202310Jul 10, 202310